Intro
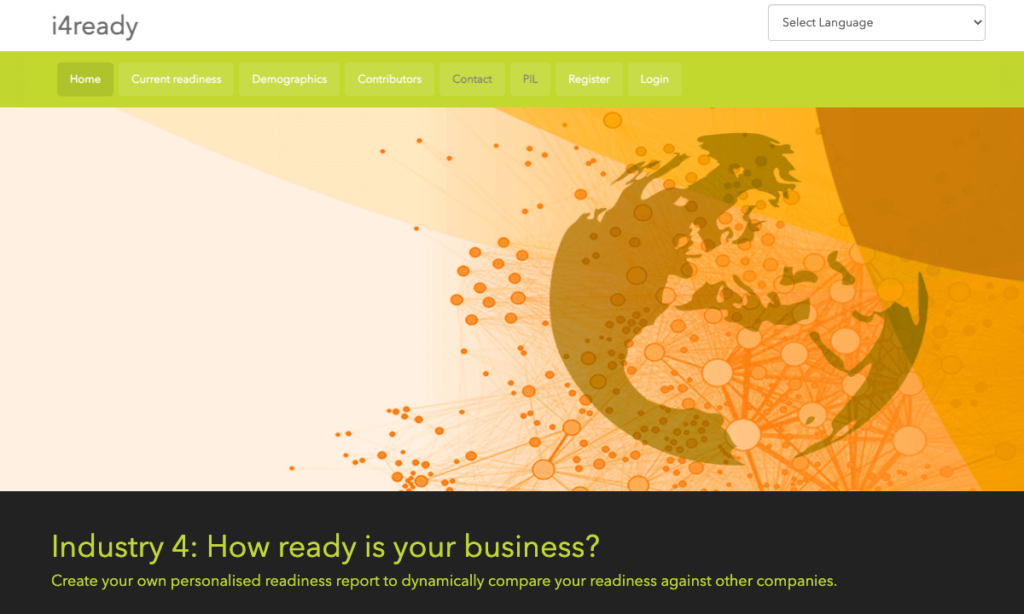
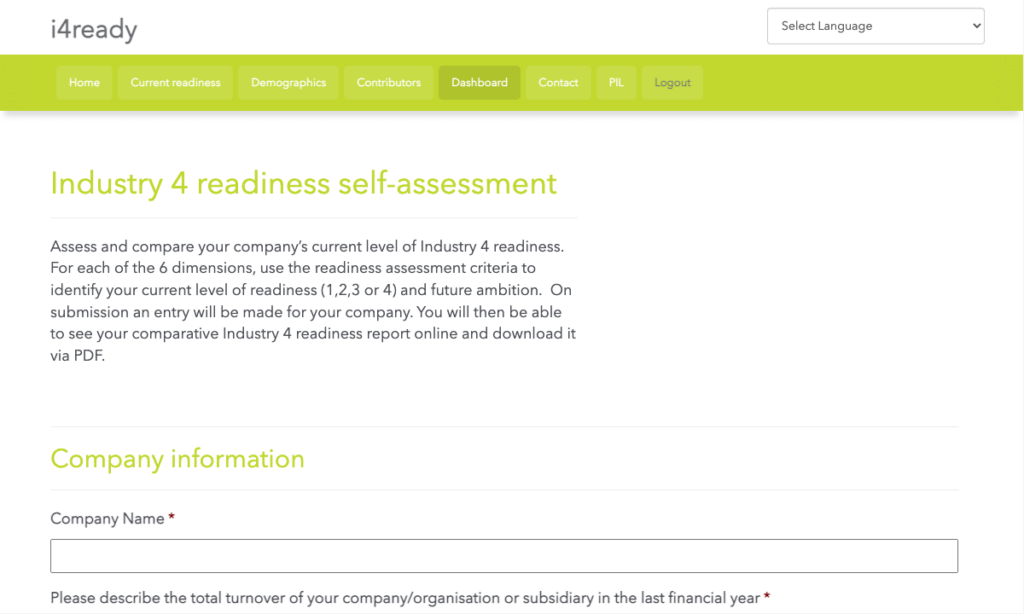
i4Ready is a bespoke website uses DomPDF and Chart.js and to create on the fly reports from user inputs based on a complicated survey about supply chains. On the surface it is a very simple looking website built on WordPress and using the Bootstrap framework, but there is some very complicated functionality built in to the website that created a series of challenges.
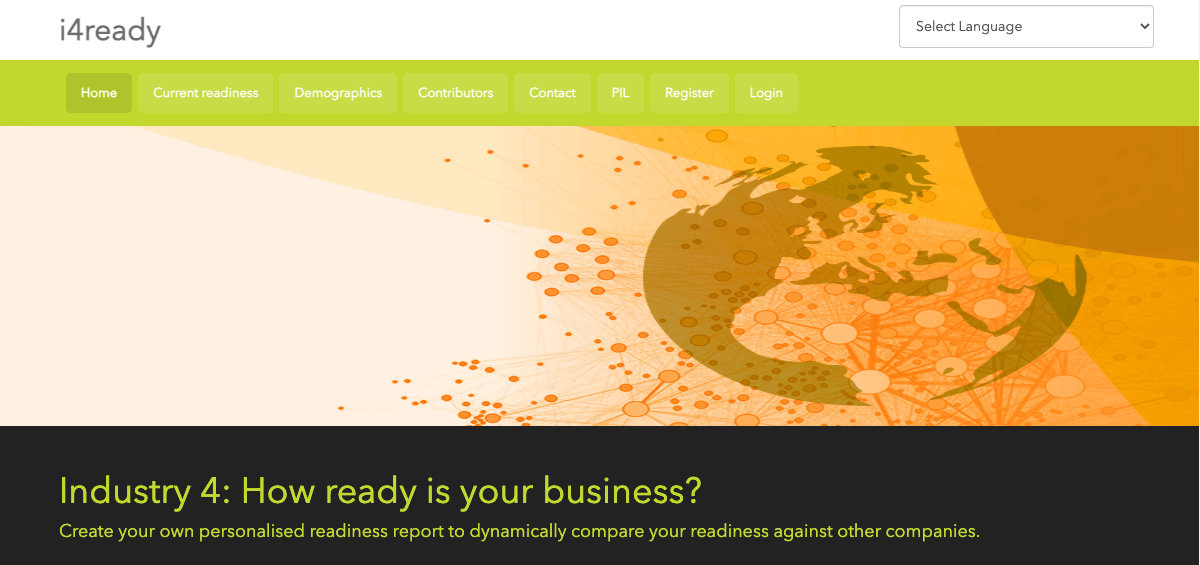
i4Ready is a data collection and analysis tool that collects the data submitted by a custom survey, and uses this to generate a bespoke report for the user showing where their company sits against other companies that took the report. It looks at key information about their company and others who took the survey and suggests where their current and future situations could be improved to be more in line with industry trends.
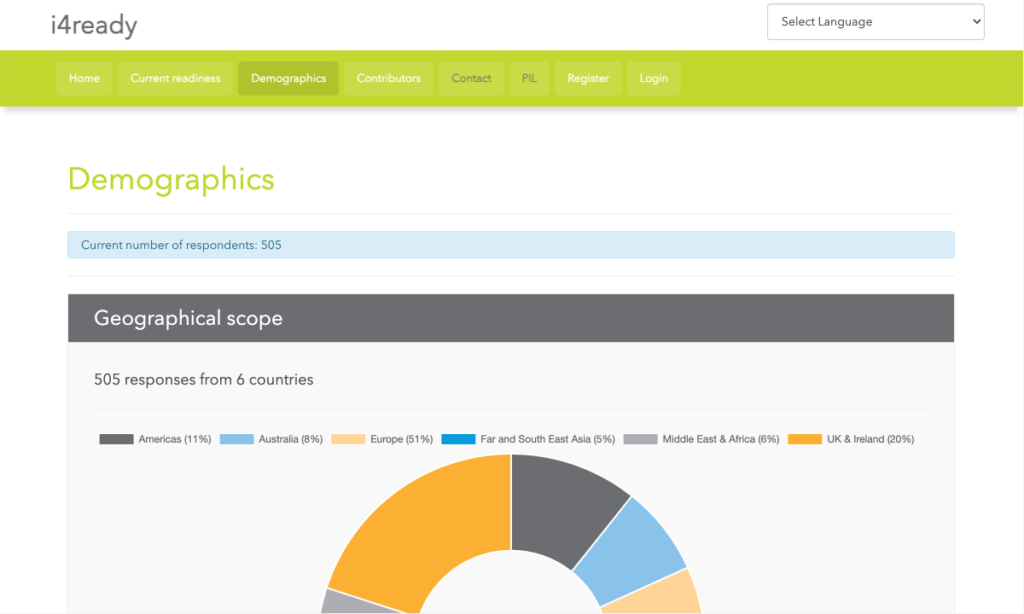
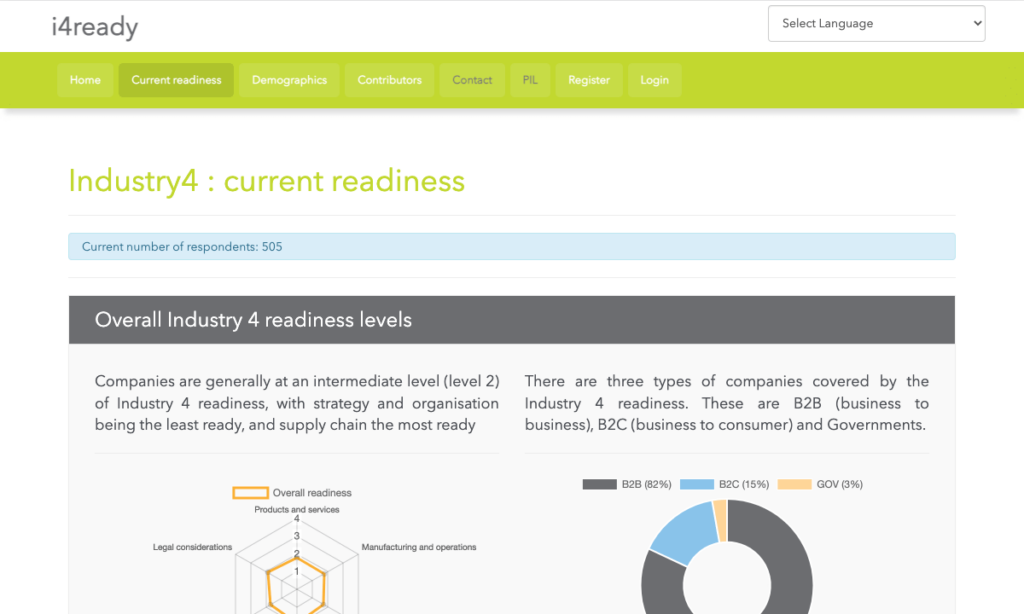
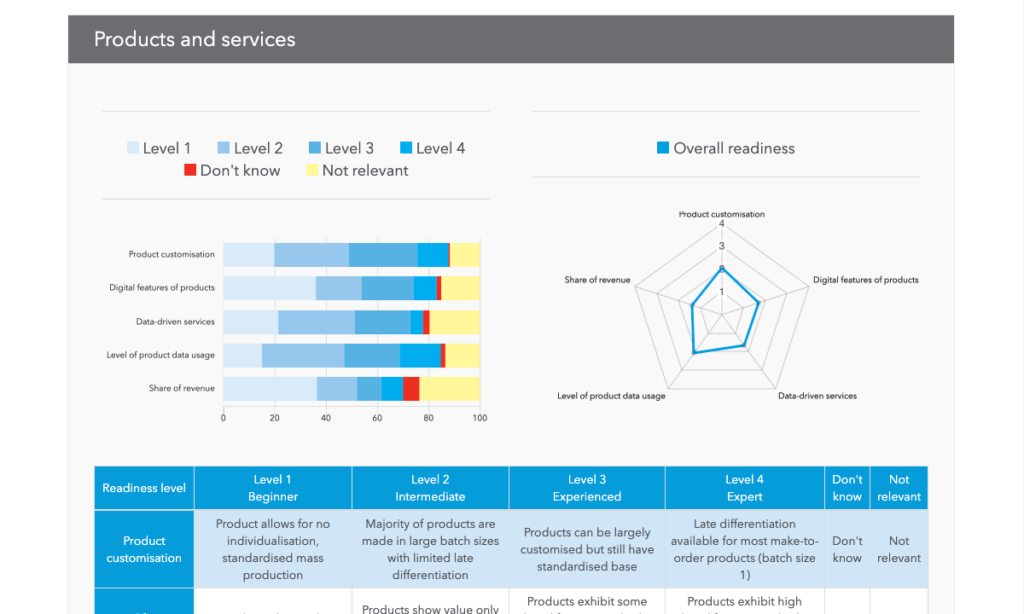
For the public user there are dynamic charts showing the current breakdown of data from the complete data set contained in the website. This data shows the types of businesses that have answered the survey and the overall averages for each of the dimensions in the model. The charts shown are dynamic, using real time information based on the complete data set. For those who are interested there is also a section of the website highlighting the demographics of the businesses that have completed the survey.
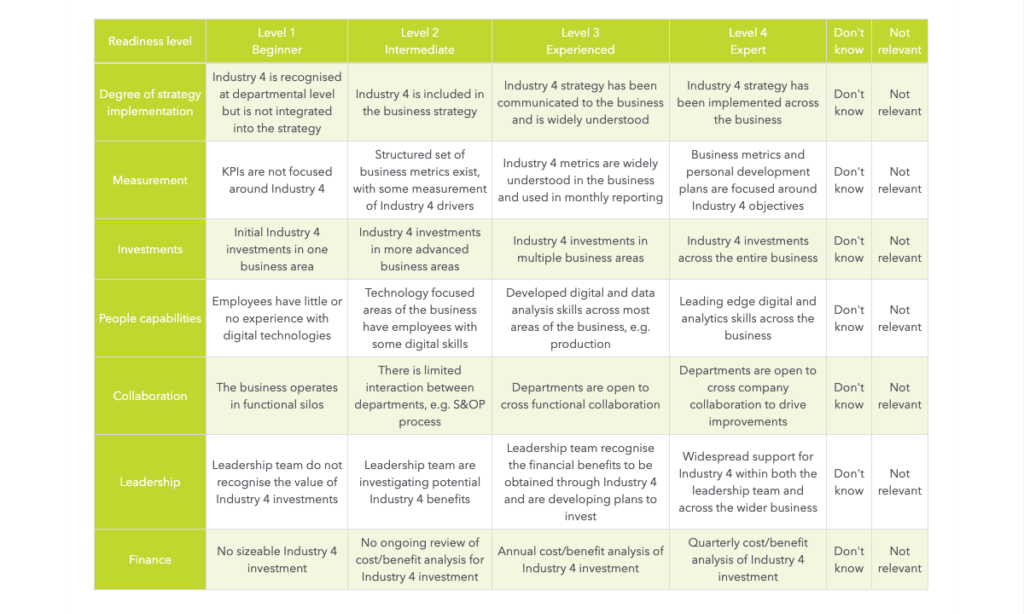
For businesses taking the survey we had to make it as simple and quick a possible to fill in the inputs while understanding the premise and scope of what they were being asked. This meant that we needed to display the survey differently and with all of the variables visible. We therefore created it as a series of tables where each answer was clickable and adaptable. The person being surveyed could easy see each option and assess where they felt they sit in the given section. The knock on effect of this meant that the user would see, read and understand all aspects of the measure, so they were able to better understand the results of the survey.
Once the user has submitted their survey, their results are added to their account as well as to the dataset as a whole. The user creates an account as part of setup so they can login at any time and view a new snapshot of their company and where they currently sit against others. They can also adapt their answers and resubmit their company keeping their listing fresh. As a result the website acts as a measurement tool to help it improve and keep track of it’s industry readiness.
View this WebsiteProject Gallery

Recent work
Browse our recent projects to learn more about what we've done.

GET A QUOTE
Hello! Thanks for browsing our website. If you want to ask us a question or get a quote on a website give us a call, or send us an email. We look forward to discussing your project and helping you achieve your goals.
REACH US
- 20 Hillfield Gardens, Nantwich, CW5 7BU
- 01270610374 | 07828756333
- [email protected]
"*" indicates required fields